Home > Sandwich ELISA Kits > Mouse Peroxisome Proliferator Activated Receptor Alpha (PPAR-α) ELISA Kit
Product Name:
Mouse Peroxisome Proliferator Activated Receptor Alpha (PPAR-α) ELISA Kit
Cat.#:
JL12627
Regulatory Status:
Alternative:
NR1C1; PPAR-A; HPPAR; Nuclear Receptor Subfamily 1 Group C Member 1
Detection Method:
ELISA
Assay Type:
Sandwich
Detection Range:
0.156-10ng/mL
Sensitivity:
0.079ng/mL
Specificity:
This kit recognizes Mouse PPAR-α in samples. No significant cross-reactivity or interference between Mouse PPAR-α and analogues was observed.
Sample Type:
Serum;plasma;tissue homogenates;cell lysates;cell culture supernates and other biological fluids
Assay Procedure:

Research Area:
Signal Transduction
Size & Price: 
Product Datasheets
Instruction: 
| PPAR-α
Peroxisome proliferator-activated receptor alpha (PPAR-α), also known as NR1C1 (nuclear receptor subfamily 1, group C, member 1), is a nuclear receptor protein functioning as a transcription factor that is encoded by the PPARA gene. Together with peroxisome proliferator-activated receptor delta and peroxisome proliferator-activated receptor gamma, PPAR-alpha is part of the subfamily of peroxisome proliferator-activated receptors. It was the first member of the PPAR family to be cloned in 1990 by Stephen Green and has been identified as the nuclear receptor for a diverse class of rodent hepatocarcinogens that causes proliferation of peroxisomes.| Typical data
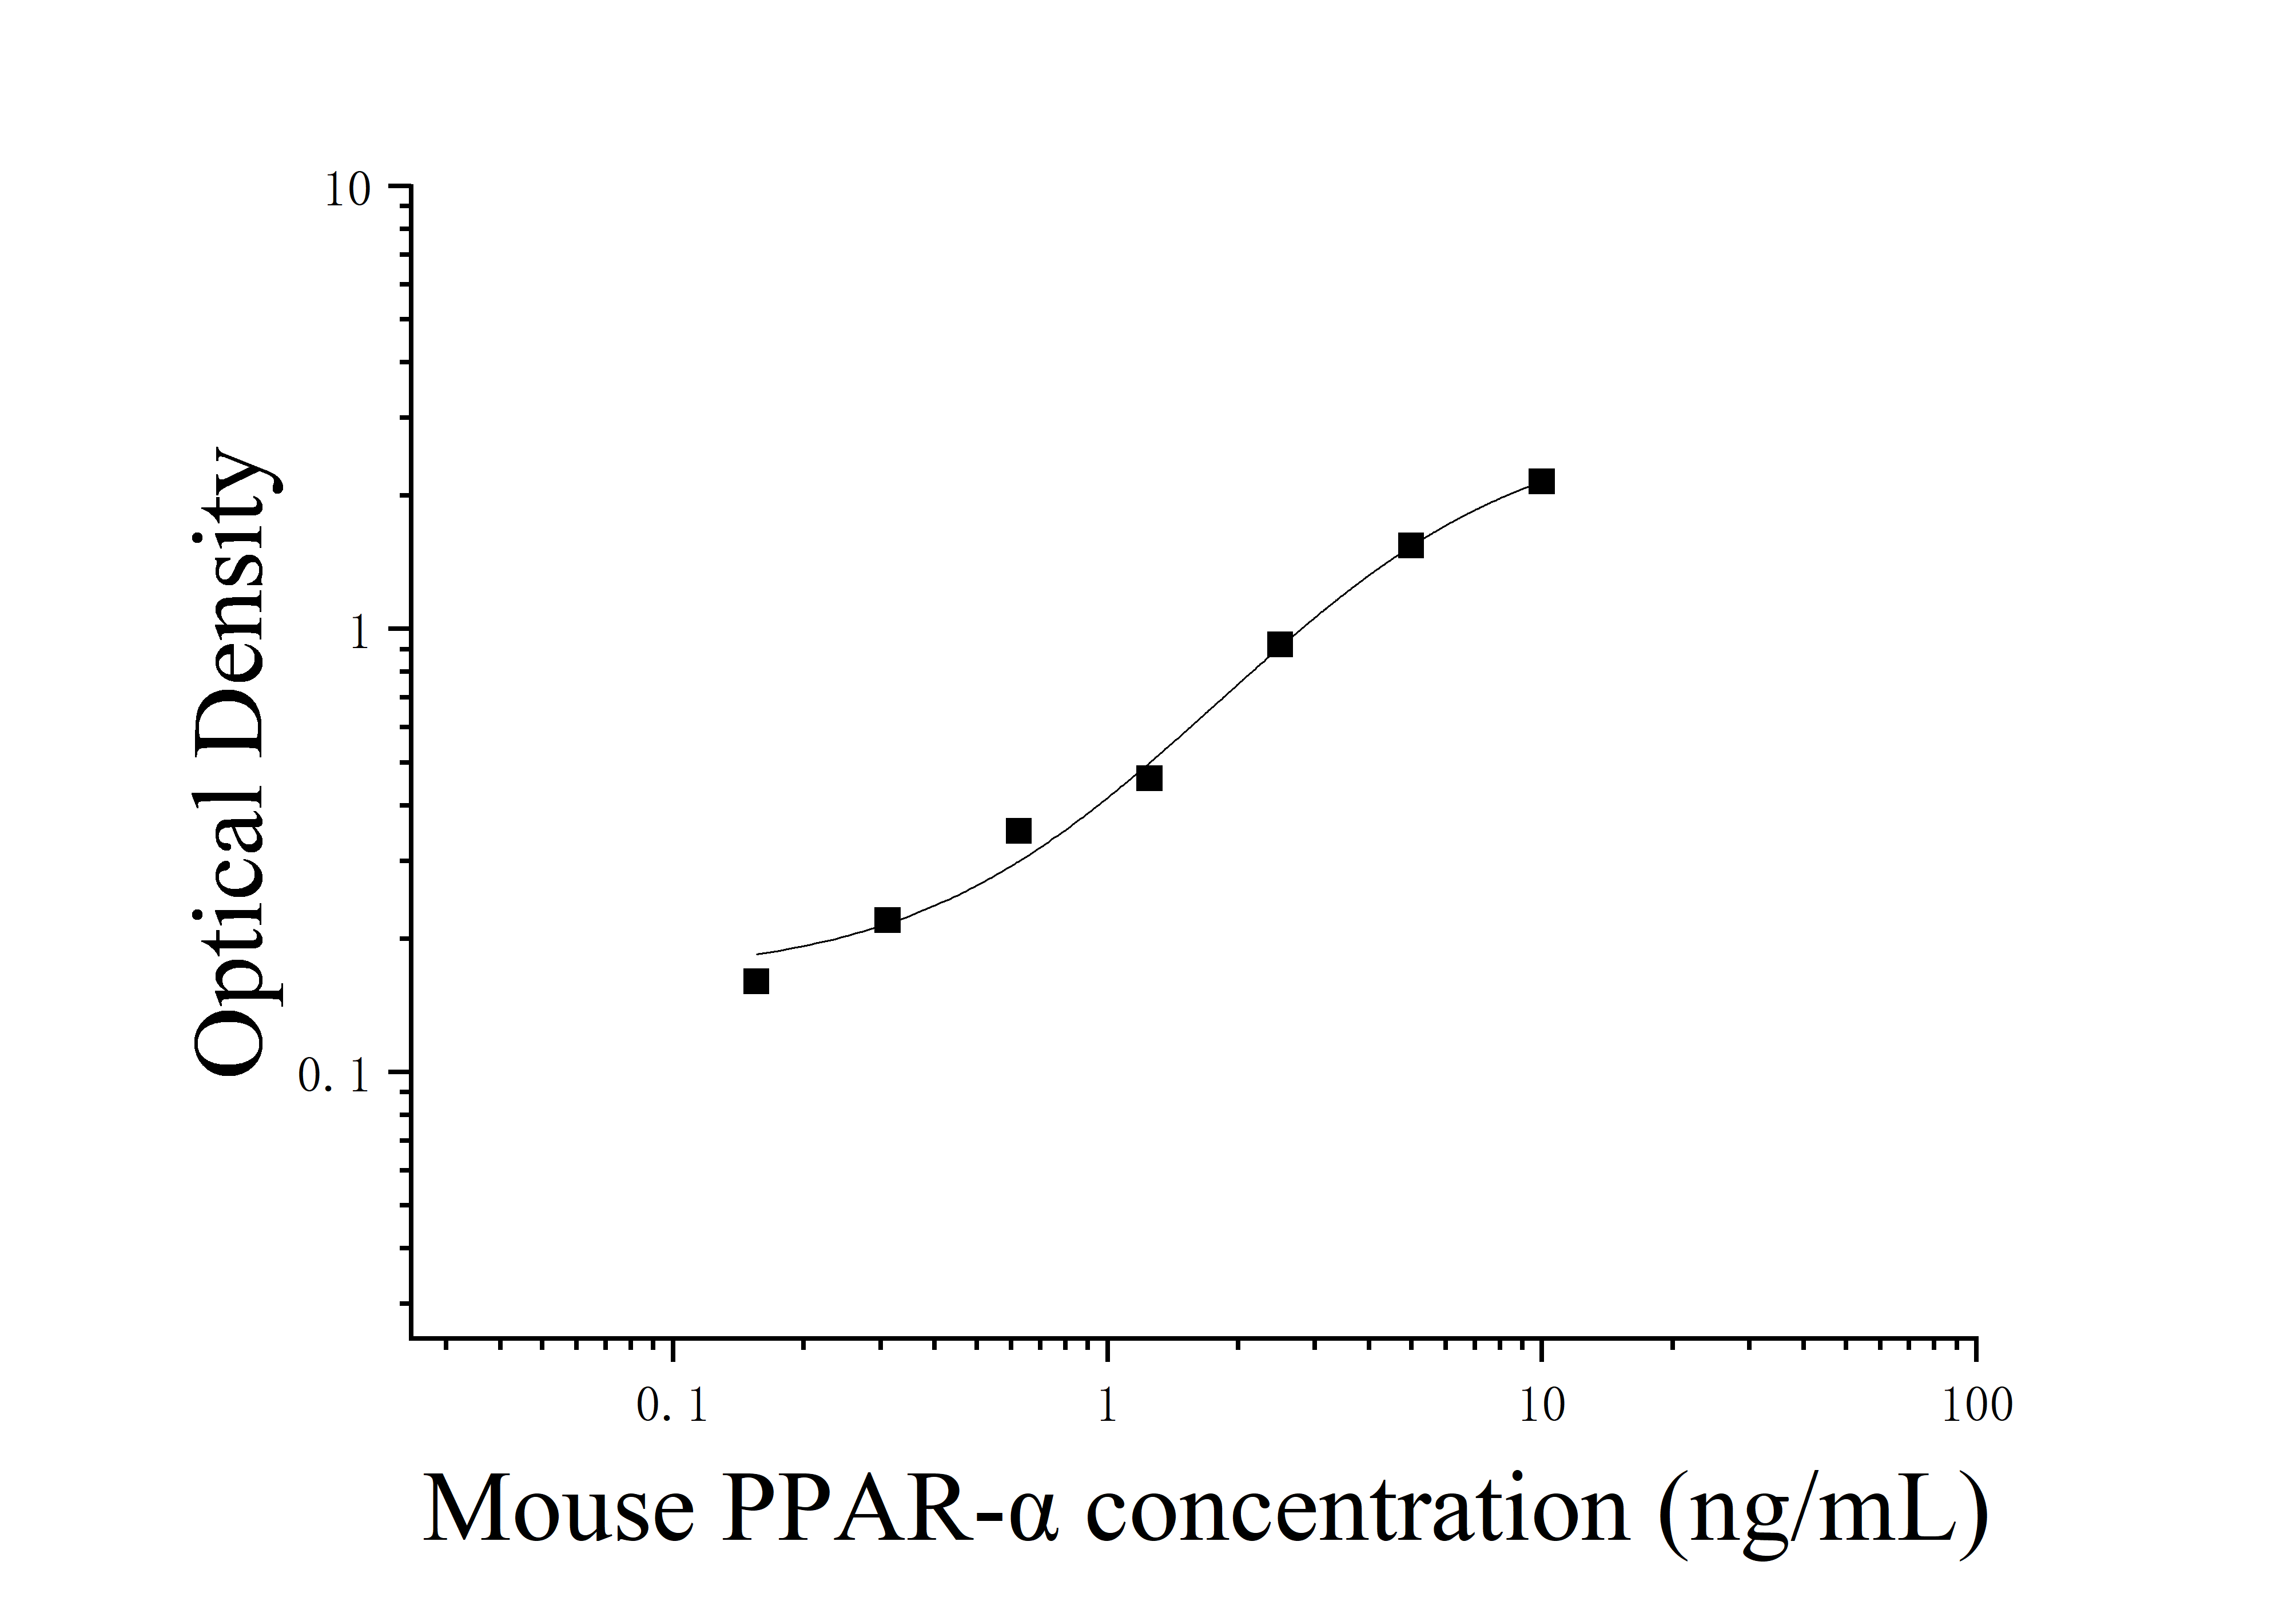
As the OD values of the standard curve may vary according to the conditions of the actual assay performance (e.g. operator, pipetting technique, wash technique or temperature effects), the operator should establish a standard curve for each test. Typical standard curve and data are provided below for reference only.| Concentration (ng/mL) | 10 | 5 | 2.5 | 1.25 | 0.625 | 0.312 | 0.156 | 0 |
| OD | 2.24 | 1.63 | 1.01 | 0.55 | 0.44 | 0.31 | 0.25 | 0.09 |
| Corrected OD | 2.15 | 1.54 | 0.92 | 0.46 | 0.35 | 0.22 | 0.16 | - |
| Repeatability
Intra-assay Precision (Precision within an assay):CV% < 10%; Inter-assay Precision (Precision between assays):CV% < 10%| Recovery
The recovery of Mouse PPAR-α spiked at three different levels in samples throughout the range of the assay was evaluated in various matrices.| Sample Type | Range(%) | Average Recovery(%) |
| Serum(n=8) | 84-101 | 96 |
| Plasma(n=8) | 92-106 | 103 |
| Cell Culture Supernates(n=8) | 96-108 | 105 |
| Linearity
Samples were spiked with high concentrations of Mouse PPAR-α and diluted with Universal Diluent to produce samples with values within the range of the assay.| Serum(n=4) | Plasma(n=4) | Cell Culture Supernates(n=4) | ||
| 1 : 2 | Range (%) | 84-95 | 88-96 | 90-110 |
| Average (%) | 91 | 93 | 96 | |
| 1 : 4 | Range (%) | 89-104 | 87-108 | 105-115 |
| Average (%) | 95 | 98 | 108 |
Related Product



Size
Quantity
Price ($)
48T
 1
1

280 / 280
96T
1
460 / 460